Excel Resource Center
As a finance and accounting professional, you likely rely on Microsoft Excel every day for financial reporting. Excel is capable of so much, but most professionals only scratch the surface of what this powerful tool can do.
Utilize Excel to its fullest potential and create effective reports quickly with these resources.
MrExcel Tips and Tricks Videos
Become an Excel Pro in no time with insightsoftware’s Excel Tips and Tricks Video Series, led by MrExcel himself.
Excel Can Do More Than You Think
One of the most used business tools, Excel is essential to finance and accounting in many organizations. Learn how to better utilize spreadsheets in your financial reporting with these resources.

Top 10 Excel Blogs of 2023

Sample Reports and Dashboards
Excel is a great tool that finance teams can utilize to build reports and models. Check out these sample reports that display metrics, tables, and data in simple and easily digestible ways.
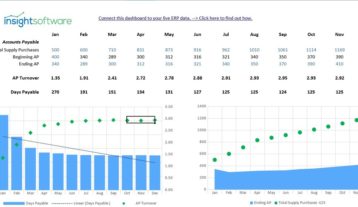
AP Turnover Model
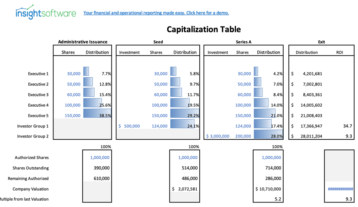
Cap Table Report
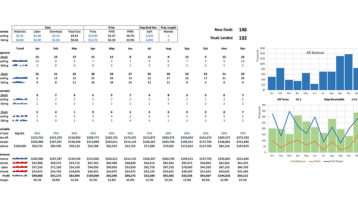
Construction KPI
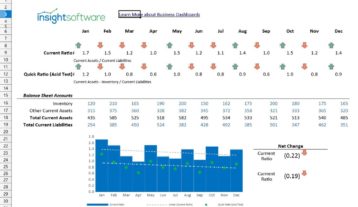
Current Ratio Model
What’s New in Excel for Financial Professionals?
Microsoft has announced several new calculation functions for Excel, from a better XLOOKUP function to new dynamic array functions SORT, FILTER, UNIQUE, and SEQUENCE, to a new geography and stock function FIELDVALUE. While these functions are already in Excel for Office Insiders, you should expect them to arrive in your subscription of Office 365 soon.
During this one-hour webinar, Microsoft MVP Mr. Excel will demonstrate:
- How XLOOKUP is faster and less error-prone than VLOOKUP
- XLOOKUP’s ability to return all 12 months in a single formula, which is exciting enough to make the INDEX/MATCH people switch
- How to return geography and stock price information using FIELDVALUE
- Sort and filter with a formula using SORT, FILTER, and UNIQUE
- How the lowly SEQUENCE function will super-charge all calculation functions in Excel.